pOlyphonic

Microsite for Audiophiles
Web Design
Illustrations
Data Visualization
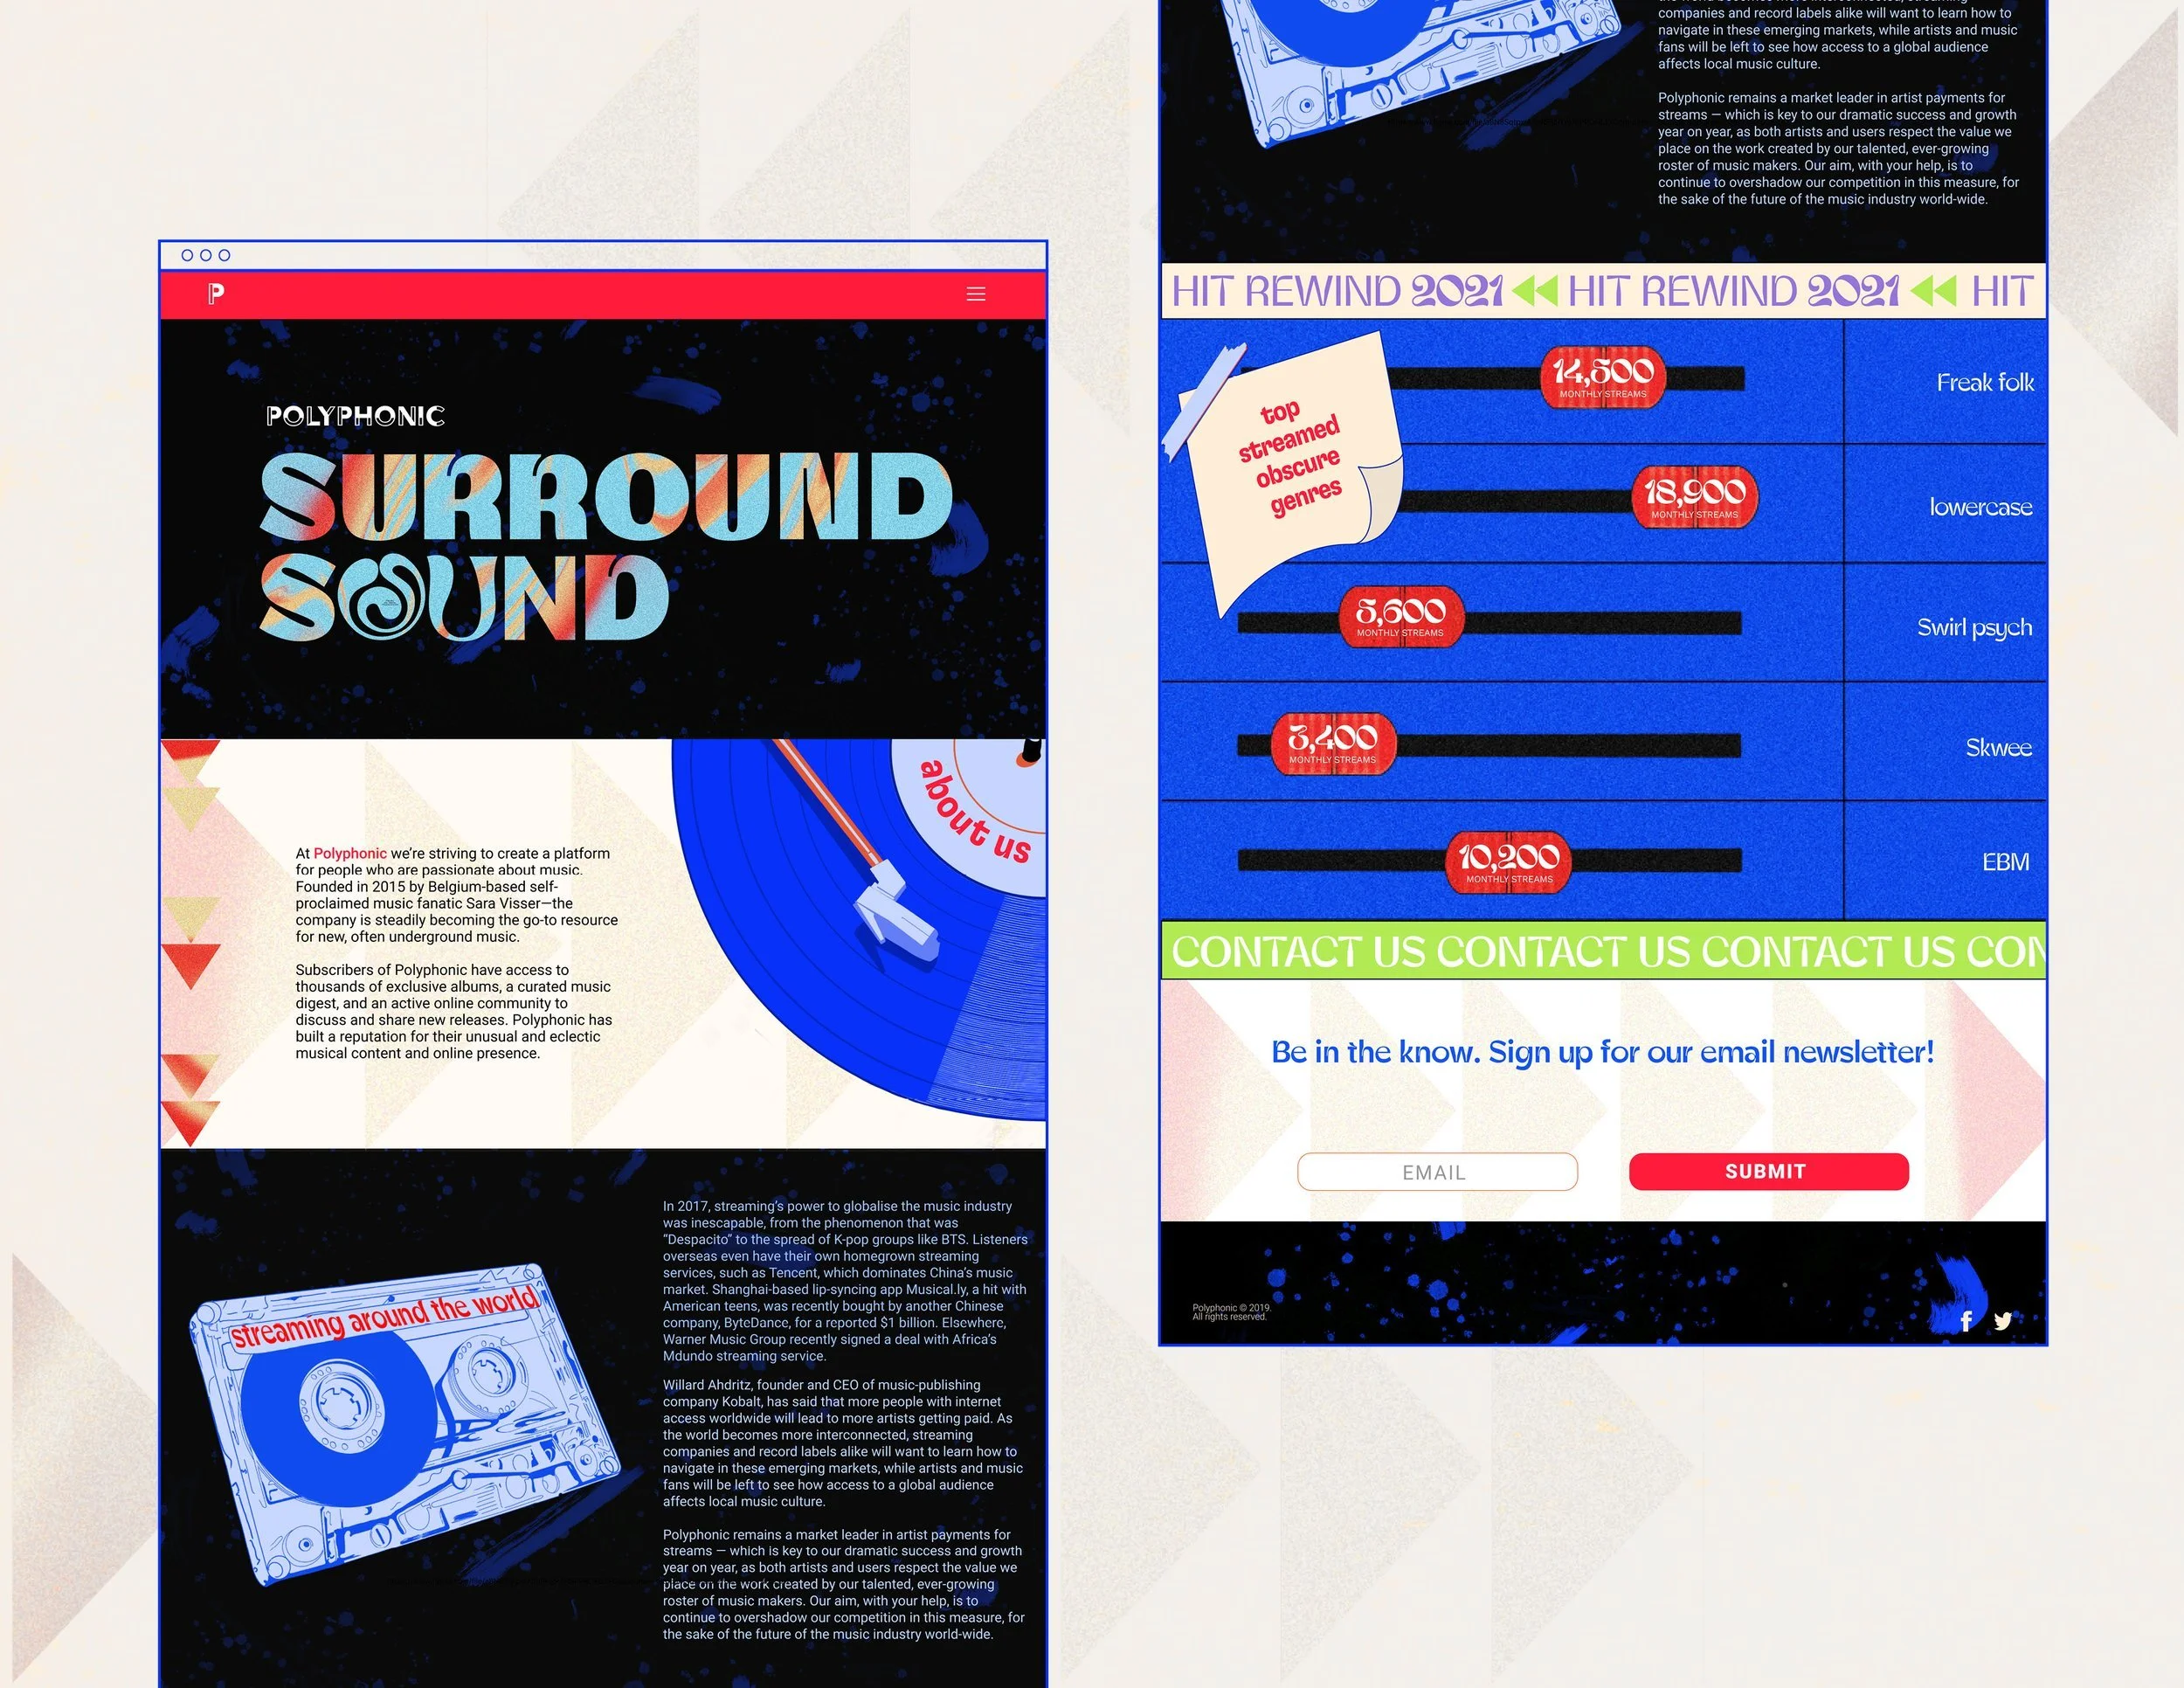
custom data visualizations: listening analytics is an illustrated sound board serving as a bar graph
Designed a digital microsite experience for audiophiles.




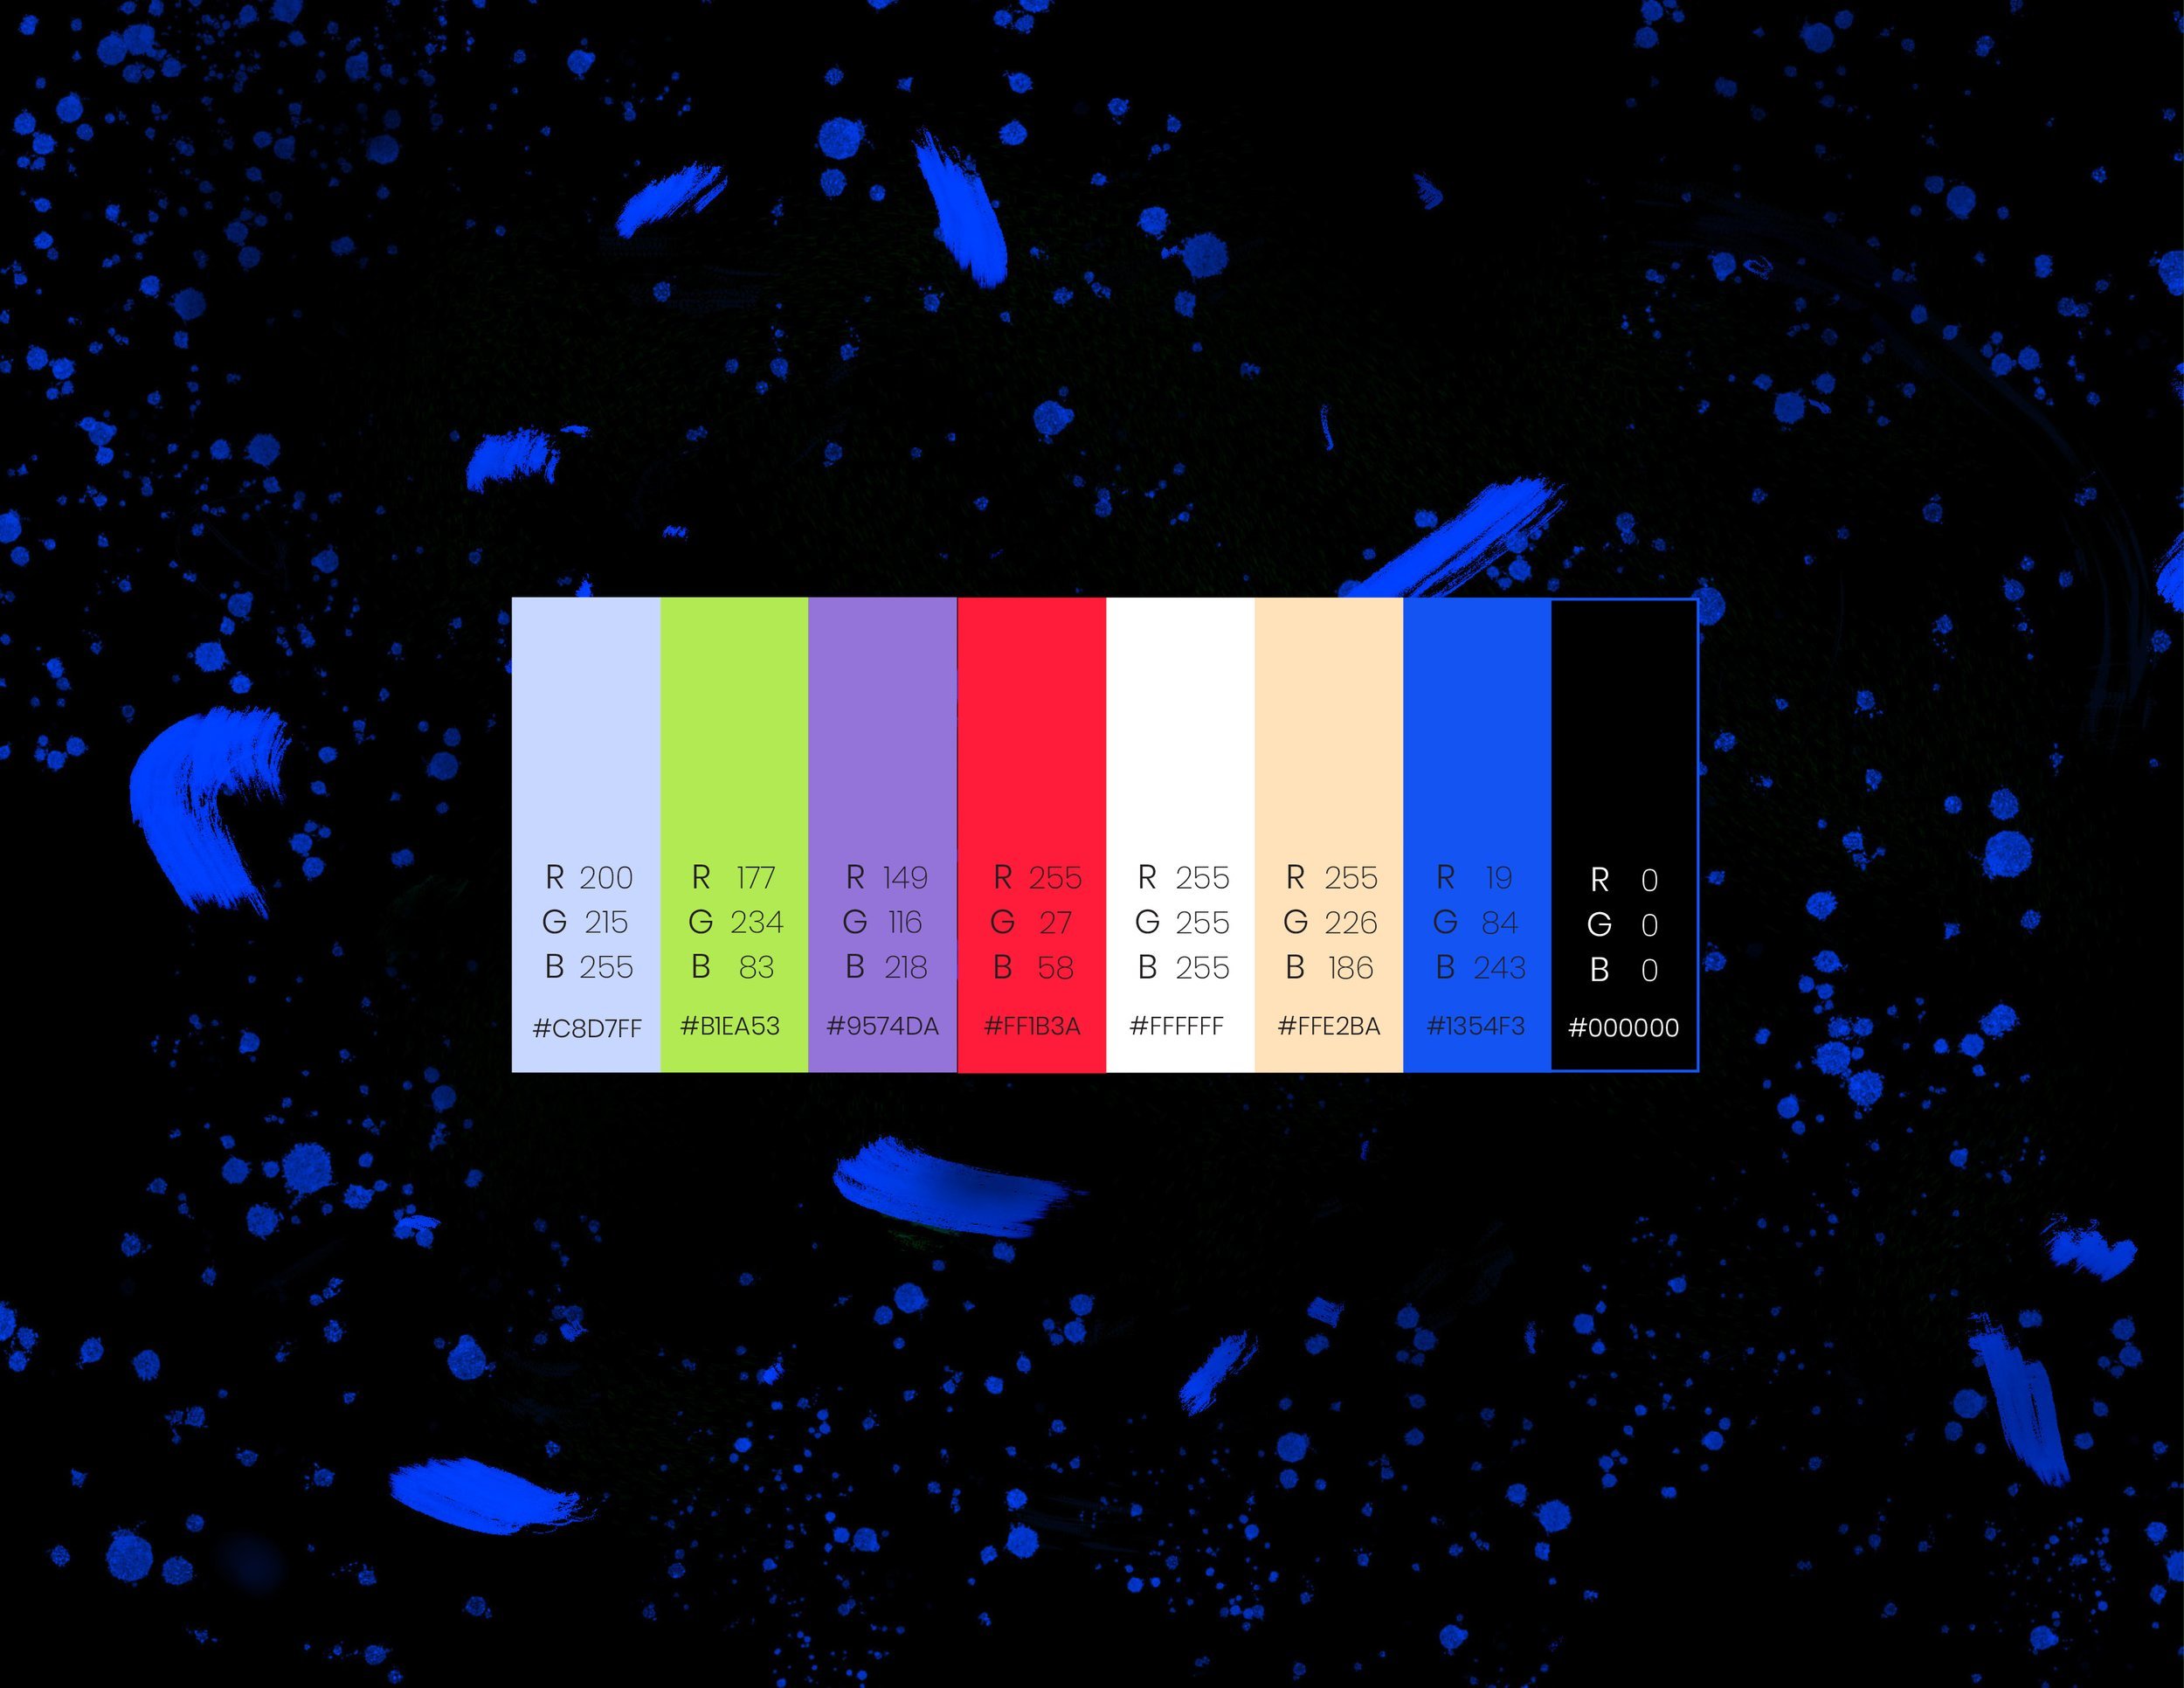
The visual system, graphics, and information architecture were designed around the nostalgia of analog music (records, cassettes, 90s grunge textures, rewind and fast-forward symbols).